How to Use Zabbix
Traducciones al EspañolEstamos traduciendo nuestros guías y tutoriales al Español. Es posible que usted esté viendo una traducción generada automáticamente. Estamos trabajando con traductores profesionales para verificar las traducciones de nuestro sitio web. Este proyecto es un trabajo en curso.
Zabbix is a versatile open-source monitoring tool for tracking the performance and availability of various network components. It includes an intuitive user interface and supports a powerful notification system. This guide briefly provides some background on Zabbix and explains how to configure and use it.
What is Zabbix?
Zabbix is a distributed performance monitoring solution. It allows administrators to monitor Linux servers alongside other network devices such as servers and routers. Zabbix includes a sophisticated dashboard that provides a high-level overview of the entire network of corporate infrastructure. It prominently highlights ongoing problems and can be filtered for ease of use.
The Zabbix user interface displays a wide selection of client data. Standard profiles collect and organize common metrics including CPU and memory usage, I/O statistics, network throughput, port accessibility, and process status. Linux clients run a Zabbix agent to monitor local resources and applications. The clients transmit these reports to the Zabbix server using a standard format.
Zabbix can also collect information from non-Linux clients through a variety of protocols and methods. For example, it can use Simple Network Management Protocol (SNMP) messages to retrieve router information. The Zabbix server uses polling and trap notifications to collect other network statistics.
Zabbix allows users to define triggers based on the value of a monitored data item. A trigger activates when a predetermined threshold is exceeded or a certain condition is met, leading to a notification on the Zabbix dashboard. Triggers can also initiate actions. One possible action sends a real-time notification to administrators, so they receive an immediate alert when a problem occurs. Users can also monitor devices using the Zabbix web interface. Zabbix stores the data collection in a local database. The data can be used to better understand intermittent outages and long-term performance.
Some of the main highlights and advantages of Zabbix are as follows. See the list of Zabbix features for a more comprehensive list.
- It is available as a free open-source application.
- A flexible notification mechanism allows administrators to receive alerts via email, SMS, Slack, and other channels. Threshold definitions for alarms are fully configurable.
- It includes a customizable and intuitive GUI for data visualization. Zabbix supports real-time graphs.
- Configuration can be performed using templates and point-and-click techniques. Programming skills are not required.
- Users can store system metrics for later analysis.
- It features proxy support.
- Encryption is supported across the client-server connection.
- Zabbix is highly-scalable and can collect information from thousands of servers and devices.
- It includes a standardized API for integration with third-party applications and reporting tools.
- It is widely-used in industry and has a strong community.
Before You Begin
If you have not already done so, create a Linode account and Compute Instance. See our Getting Started with Linode and Creating a Compute Instance guides.
Follow our Setting Up and Securing a Compute Instance guide to update your system. You may also wish to set the timezone, configure your hostname, create a limited user account, and harden SSH access.
The Zabbix server software must already be installed on a Linode. Consult the documentation on Deploying Zabbix Using the Linode Marketplace for more information.
sudo. If you are not familiar with the sudo command, see the
Users and Groups guide.How to Configure Zabbix
To use Zabbix to monitor a Linux host, the host must be running the official Zabbix client. Configuration information can be added using the Zabbix web frontend and GUI.
How to Install the Zabbix Server
Although Zabbix can be installed from the source code or packages, it is quicker and easier to use the Linode Marketplace. For information on how to install Zabbix using this method, see the Zabbix Marketplace documentation. Currently, the Marketplace only supports Zabbix installations on CentOS. For package installation guidelines for other Linux distributions, see the Zabbix installation instructions.
How to Install the Zabbix Client
To monitor an external host, install the Zabbix client software on the system. This allows the Zabbix server to add the device to its list of hosts. These instructions apply to Ubuntu 22.04 LTS but are generally applicable to other Linux distributions. To configure a system as a Zabbix client, follow these steps. These instructions must be executed on the system you want to monitor, not on the Zabbix server.
Ensure the client system is up to date. Reboot the system if necessary.
sudo apt-get update -y && sudo apt-get upgrade -yDownload and install the Zabbix repository. The following instructions install release 6.0 of the client agent. This aligns with the release of the Zabbix server software available in the Linode Marketplace.
wget https://repo.zabbix.com/zabbix/6.0/ubuntu/pool/main/z/zabbix-release/zabbix-release_6.0-4+ubuntu22.04_all.deb
sudo dpkg -i zabbix-release_6.0-4+ubuntu22.04_all.deb
Update the repository.
sudo apt-get update -yUse
aptto install thezabbix-agentpackage.sudo apt install zabbix-agentRestart and enable the
zabbix-agentservice.sudo systemctl restart zabbix-agent sudo systemctl enable zabbix-agentVerify the status of the agent and ensure it is
activeto confirm that it is running correctly. If the status is not active, review the installation and configuration steps for any errors.zabbix-agent.service - Zabbix Agent Loaded: loaded (/lib/systemd/system/zabbix-agent.service; enabled; vendor > Active: active (running) since Tue 2023-06-27 11:25:30 UTC; 17s ago
How to Configure the Zabbix Client Agent
After installation, add configuration to the zabbix_agentd.conf file. This allows the server to recognize the client and transmit data using shared key encryption.
(Optional) Secure the agent-server connection using a pre-shared key (PSK). Use the
opensslutility to generate a PSK and save it to a file.Note Signed certificates from a certificate authority are even more secure but require a fully-qualified domain name for both the server and agent. For more information on this method, see the Zabbix Certificate Encryption instructions.sudo sh -c "openssl rand -hex 32 > /etc/zabbix/zabbix.psk"(Optional) Display the PSK key and ensure you save it in a secure location. This key is required to establish a secure connection with the server.
cat /etc/zabbix/zabbix.psk268d5fa6e8ba1a0fa154d95f6b8472087d04aa45c42bef6f971d9fd107bebc0eEdit the agent configuration file at
/etc/zabbix/zabbix_agentd.conf.sudo vi /etc/zabbix/zabbix_agentd.confMake the following changes.
- Change the value of
ServerandServerActiveto the IP address of the Zabbix server. - Change the
Hostnameto the hostname of the Zabbix server (not the client’s hostname). This is the server name specified at creation time in the Linode Marketplace. In this example, the hostname iszabbixserver. - (Optional) To enable PSK encryption, add the following values:
- Set
TLSConnectandTLSAccepttopsk. - Set the key name to a unique Key ID. For this example, set
TLSPSKIdentitytoPSK 001. - Uncomment the
TLSPSKFileline and set it to/etc/zabbix/zabbix.psk, which is the location of the PSK file.
- Change the value of
The
zabbix_agentd.confshould resemble the following example. Changeserver_IPto the actual IP address of the Zabbix server. Leave the remainder of the lines unchanged.- File: /etc/zabbix/zabbix_agentd.conf
1 2 3 4 5 6 7 8 9 10Server=server_IP ServerActive=server_IP ... Hostname=zabbixserver ... TLSConnect=psk TLSAccept=psk ... TLSPSKFile=/etc/zabbix/zabbix.psk TLSPSKIdentity=PSK 001
Apply the changes by restarting the Zabbix agent.
sudo systemctl restart zabbix-agent
How to Add a New Host to the Zabbix Server
The client is fully configured and is ready to connect to the server. To add the new host, perform the following instructions using the web interface on the Zabbix server.
Click on Configuration to expand the configuration menu. Then click Hosts.

Click the Create host button on the top left of the screen.
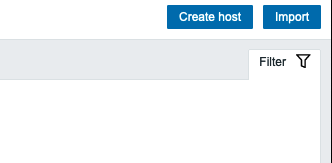
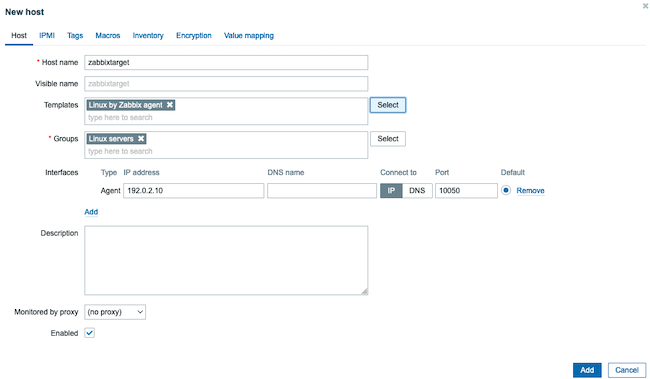
Zabbix displays the
hostconfiguration page. Under the Host tab, add the following information. Do not save the information yet.- Enter the
Hostname. This is the hostname of the server running the agent, in this case,zabbixtarget. - In the
Templatefield, useLinux by Zabbix agent. Start typing this phase to narrow down the choices using auto-search. - Add the server to a
group. Choose an existing group using the Select button to the right of the text box. Click the name of the group and then click Select. In this example, the target node is added to theLinux serversgroup. - Enter the IP address of the target node. Click the Add link under the
Interfacestext box and selectAgent. In the submenu, enter the IP address. EnsureIPis selected for theConnect Tofield.
- Enter the
Select the Encryption tab from the top line of the configuration widget. Enter the following information.
- For
Connections to host, choosePSK. - For
Connections from host, enterPSK. DeselectNo Encryption. - In the
PSK identityfield, typePSK 001. This is the name of the key on the target node. - Enter the PSK key for the target in the
PSKkey field. This key should match the one stored in/etc/zabbix/zabbix.pskon the target node.

- For
Click the Add button in the lower right corner of the configuration widget to complete the configuration task. Zabbix reloads the
Hostspage, and the newzabbixtargethost is displayed. TheAvailabilitybutton displays theConnectionstatus. A green button indicates an active connection. It takes a minute or two to establish the connection.Note Due to the default polling interval, it might be necessary to refresh the page to update the information. If the button turnsRed, click on it to review the root cause of the problem. Make any necessary changes based on the error message.

How to Use Zabbix
Configure the application using the web frontend. The Zabbix Dashboard highlights the state of the network. For a more comprehensive introduction, see the Zabbix Quickstart documentation.
How to View Host Data Using Zabbix
The Zabbix frontend interface allows users to immediately view information about the new host and its monitored data. Follow the steps below to access and analyze monitoring data in Zabbix:
Click Monitoring on the side panel, then select Latest Data. This view provides an overview of all available monitoring data.

The Zabbix interface displays information from both the server and the host client. To filter the information so Zabbix only displays data for the client, click
zabbixtargetunderHosts.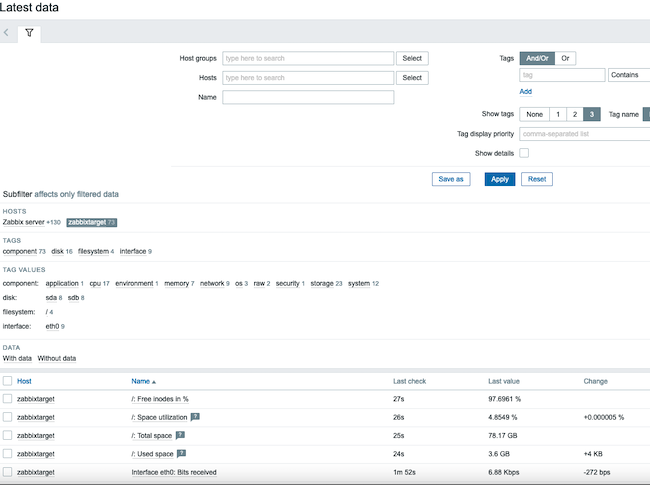
Although a broad overview is sometimes useful, it is often more practical to monitor a single item. Choose an item from the list, for example,
Used space, and click the Graph link to the right side of the list item. Zabbix displays a graph of the metric’s history over time. Filters can be used to adjust the time frame of the display.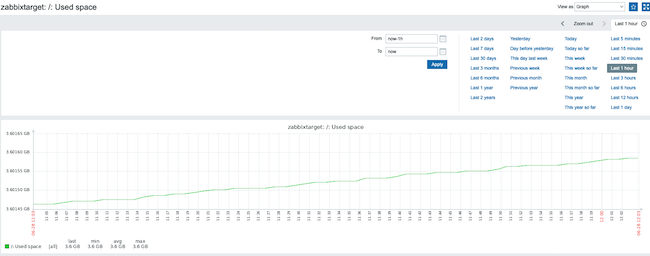
Zabbix currently collects information from the host according to the
Linux by Zabbix agentprofile. This template supports a reasonably large selection of the most common system statistics. However, it is possible to monitor additional items, allowing for more targeted oversight. To add a new item to the list of attributes, click Configuration and then Hosts.
In the row corresponding to the remote host, click on the Items link.

Click on the Create Item button in the upper right corner of the user interface.

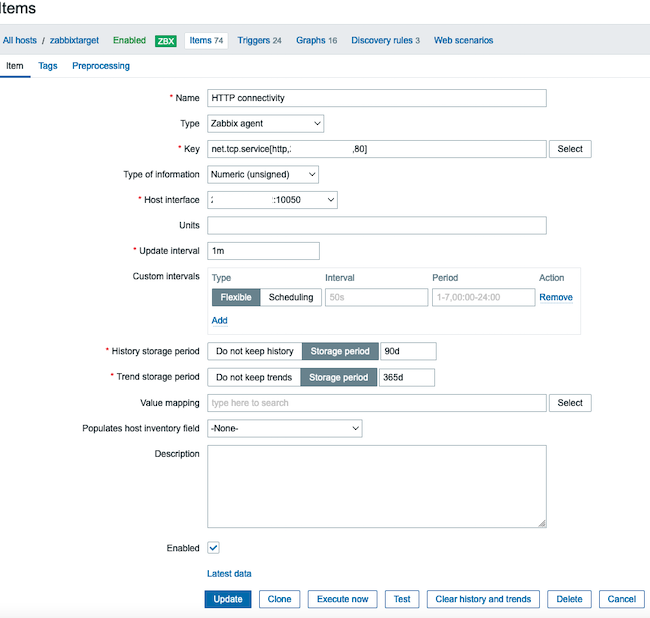
In this example, the new item monitors TCP port
80on the remote host. Provide a name for the service, such asHTTP Connectivity.- For
Type, chooseZabbix Agent. - For the
Key, specifynet.tcp.service[http,<ip>,80]. Replaceipwith the IP address of the agent. The HTTP service runs on TCP port80. - If the port is accepting connections, the status is
1. If this query returns0, the port is not accepting connections, so the site cannot be accessed. - The default
Update Intervalis1m, but this can be changed.
After adding all the details, click Add.
- For
To confirm that the new item has been added, click on Configuration, Hosts, and Links. The new
HTTP Connectivityitem appears in the list. The item should beEnabled.
To access the data collected by the new item, select Monitoring, then select Latest Data from the left menu. The new item appears in the list.

Click the Graph link to the right of the new item to see the results. The graph shows a constant historical value of
1. This indicates that the port has continually been up and accepting connections.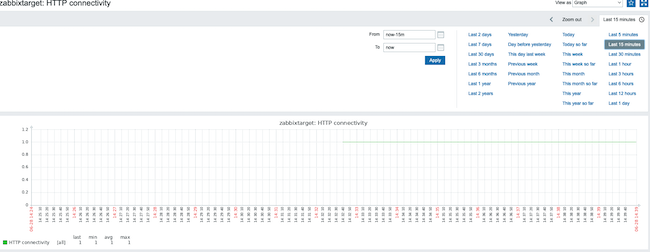
How to Configure Triggers
A Zabbix trigger alerts administrators to problems with a target. A trigger can generate a warning whenever a particular monitored value exceeds a threshold or matches a certain value. To create a trigger in Zabbix, follow the steps below:
Click Configuration, and then select Hosts. Then, select Triggers in the row corresponding to
zabbixtarget.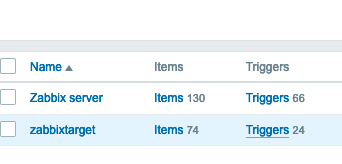
This displays a list of current triggers. Click Create trigger in the upper right corner to create a new trigger.
Zabbix displays a template to use to create a trigger. Provide the name
HTTP Downfor the trigger. Set theSeveritylevel toHigh.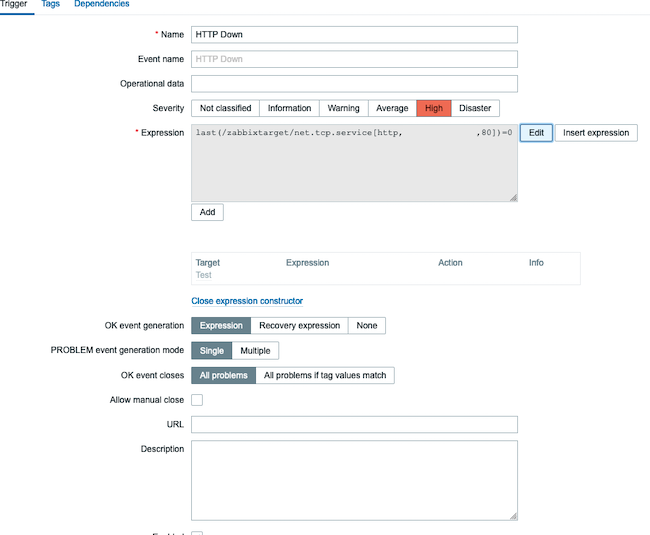
Construct the expression using the Add button to the right of the
Expressiontext box.- For the
Item, select thezabbixtarget: HTTP connectivityoption. - Choose the
Functionnamedlast(). Set the value ofResultto0.0indicates the port is not accepting connections and the web server is not accessible. - Click Insert to complete the conditional expression.
- Select Add at the bottom of the window to add the new trigger.

- For the
To ensure the trigger is functioning correctly, generate the conditions required to activate it. In this case, shut down the webserver to disable port
80. Click Monitoring, then select Problems and wait for the alert to appear in the list ofProblems. It can take up to a minute to raise the alert due to the configuredUpdate Interval.Note After connectivity is restored, the status of the problem changes toResolved. TheProblemspage contains filters to adjust the display criteria.Recent Problemsdisplays all problems matching the timeline, including resolved issues. TheProblemsfilter only lists the active issues.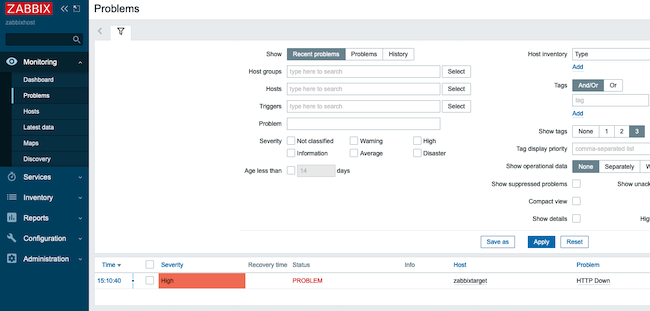
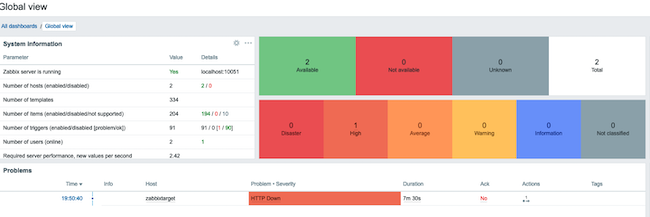
The problem can also be seen on the main Zabbix dashboard.
How to Configure Zabbix Notifications and Alerts
Zabbix can directly notify administrators in the event of a major failure. It supports several notification methods, including email, SMS, Slack, and Jira. To configure an alert, first configure contact information for the intended user. Then add an action to send a notification to the user when the trigger fires. To set up a Zabbix alert, follow the steps below:
Configure the system email settings. Click on Administration, then click Media Types.

From the list of media types, click on Email.
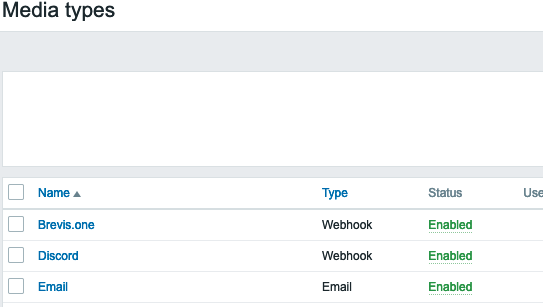
Enter the settings for the email relay server. The following settings illustrate the settings for the free SMTP2Go SMTP relay service. Select Update after adding the information. Then click the Test link on the right side of the
Emailentry to send a test mail and confirm its reception.Note Settings likeSMTP ServerandSMTP server portare server dependent. Consult the documentation for your SMTP server to determine the correct values. Most SMTP relay servers require a username and password for authentication. This information can be added to theAuthenticationsection of the form.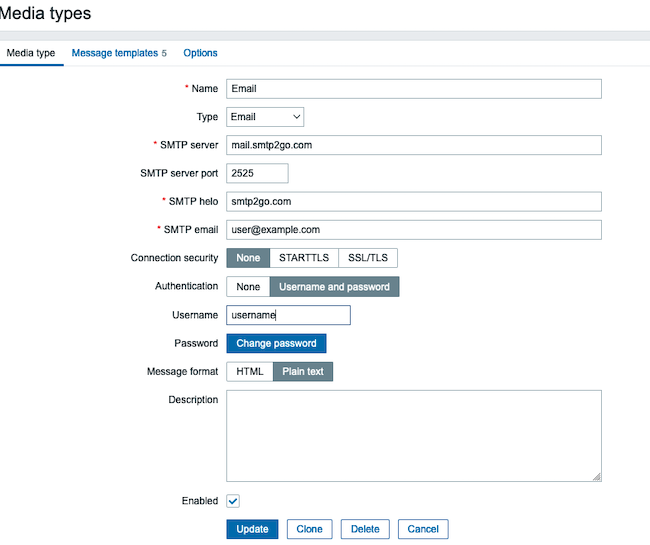
Create a new user to send the alerts to. First, click on Administration, then click Users.

To set up an email for the
Adminuser, click on the link labeledAdmin.Note To use a different account as the email recipient, select theCreate userbutton at the top right. Enter the user details before adding the email address. You must add the new user to an existing group, such asZabbix administrators, before proceeding. Edit the user permissions to grant access to the appropriate Zabbix services. See the Zabbix Quickstart User Configuration section for more details.
Click the Media tab, then click Add.
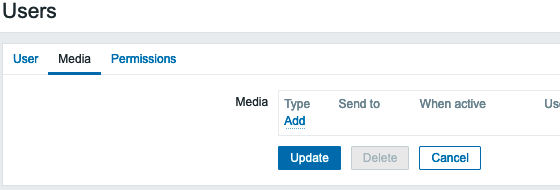
Select
Emailfor the Type field. Enter the email address under Send to. Optionally, restrict the times during which notifications should be sent using the When active settings. Define the severity levels for which the user should receive alerts under the Use if severity field.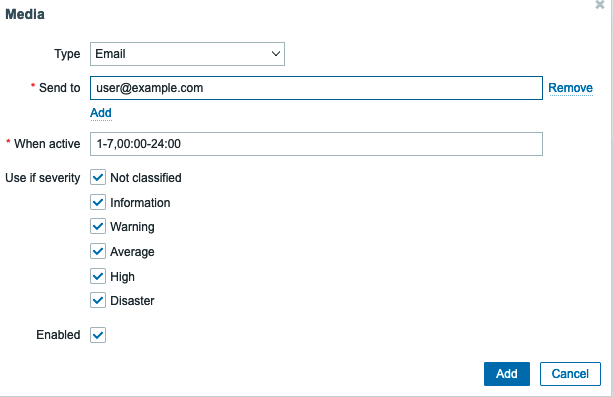
The main
Mediapage displays the new email settings. It is possible to add additional notification channels at this point. Click the Update button to apply these changes.
A Zabbix action initiates the notification. To create an action, click on Configuration and Actions. Choose Trigger Actions from the submenu. Click Create action from the submenu to add a new action.

Configure the details of the action under the Action tab. Provide a meaningful name for the action in the Name field. If the Conditions field is left blank, Zabbix sends notifications for all alerts. If necessary, add one or more conditions to narrow down the scope of the alert.
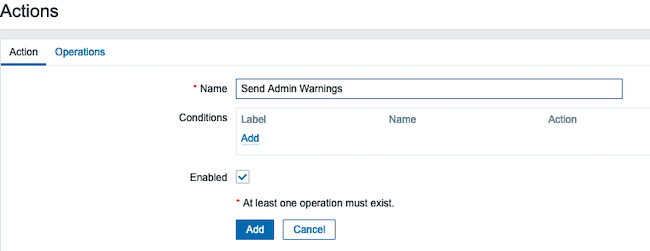
Click the Operations link at the top of the form to specify the alert mechanism. Click Add in the
Operationsblock. This displays theOperations Detailsform. Set the Operation type toSend message. Click Add inside Send To users to add the recipient.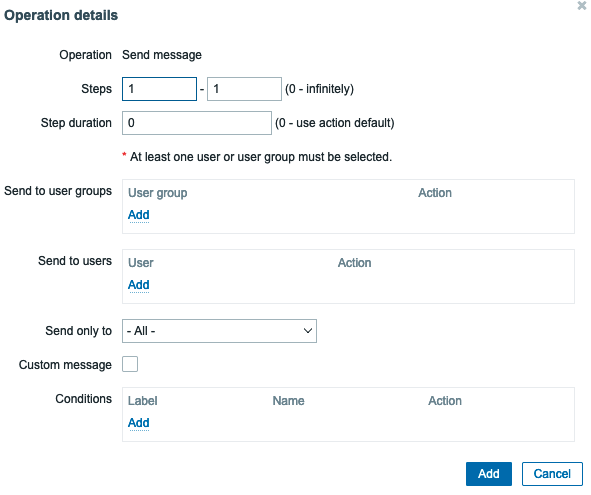
In the Users dialogue box, choose the correct user. In this example, select
Admin. Click the Select button to add the user.
Click Add to add the operation. Then click Add to finalize and add the entire action.
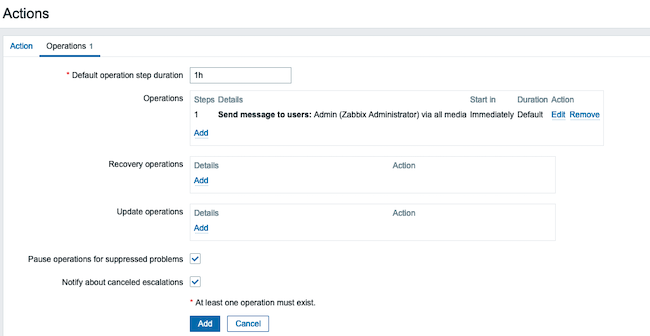
Confirm the alert is working. Shut down the web server on the target to recreate the trigger. Zabbix raises a warning inside the
Problemsdashboard and sends an email to the administrator.
Conclusion
Zabbix is a rich and flexible monitoring tool for servers and other network components. It allows users to receive notifications about problems using configurable thresholds and alarms. To use Zabbix, first install the Zabbix server from the Linode Marketplace. Then download and configure the Zabbix client on the target system. Hosts, items, and triggers are configured using the flexible Zabbix web interface. For more information on Zabbix, see the Zabbix documentation.
More Information
You may wish to consult the following resources for additional information on this topic. While these are provided in the hope that they will be useful, please note that we cannot vouch for the accuracy or timeliness of externally hosted materials.
This page was originally published on
